👋 Hi! I’m Yangtian Liu (刘阳天). I’m currently a 3rd-year PhD student in the Interactive Data Group (ZJUIDG), Zhejiang University (ZJU), under the joint supervision of Prof. Yingcai Wu and Prof. Di Weng. Before that, I received my bachelor’s degree in Computer Science and Technology in 2023 from Hunan University (HNU).
My research interests mainly focus on interactive data analytics and LLM agents.
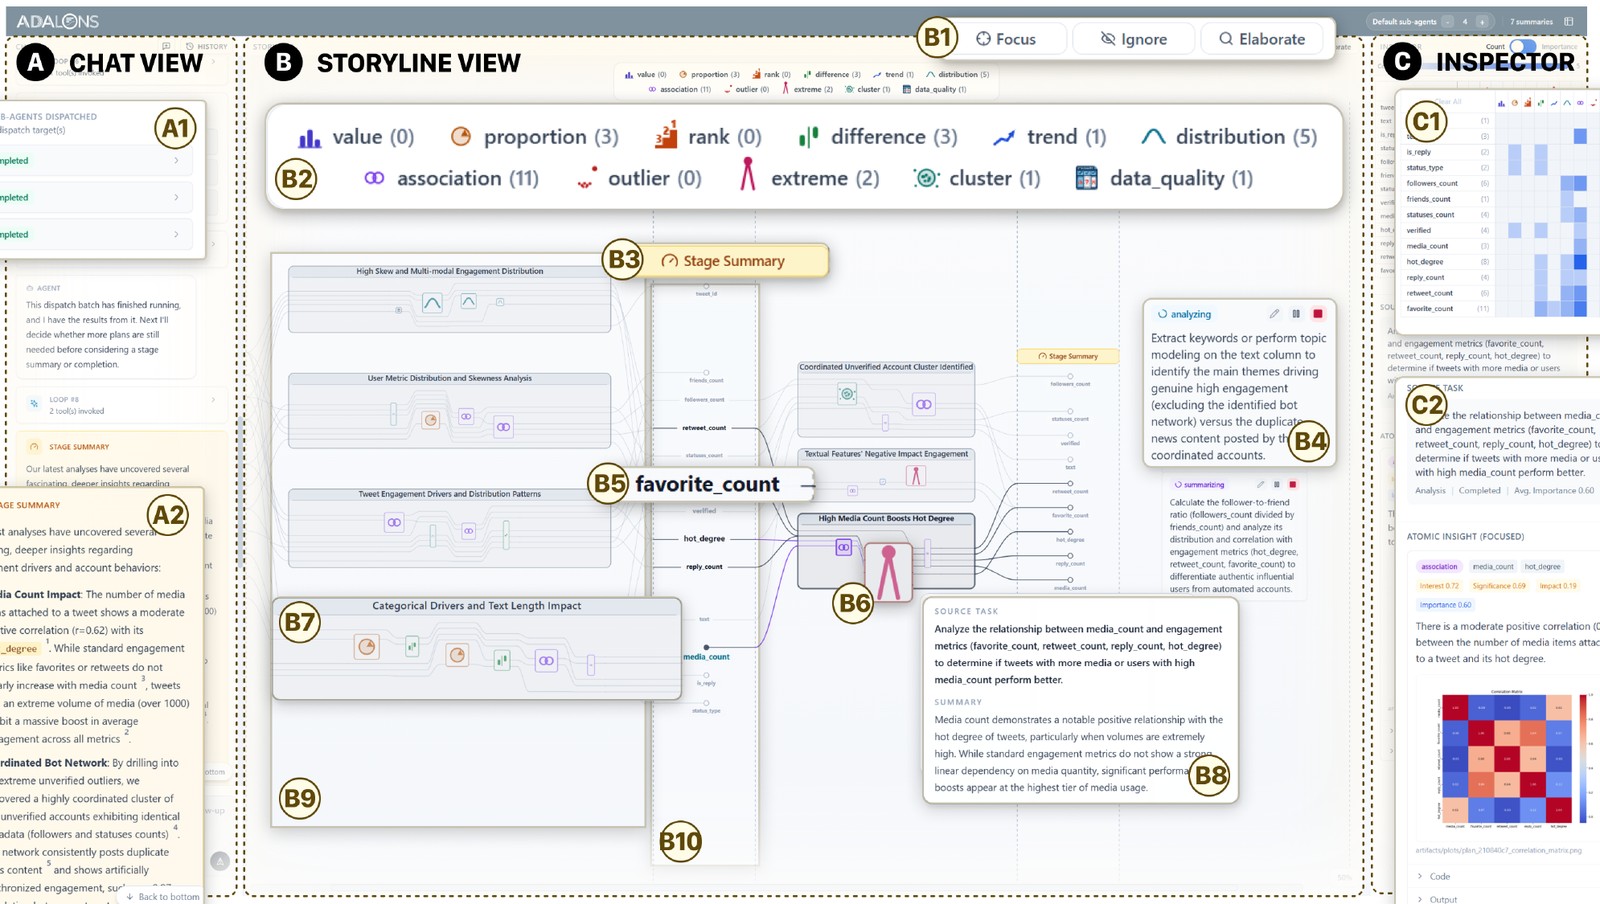
Large language models are pushing data science toward increasingly autonomous and agentic workflows, with recent systems already supporting multi-step and long-running analyses. As these workflows become more autonomous, conventional interfaces no longer provide adequate support for two critical requirements: observability for understanding an agent’s evolving reasoning and evidence, and steerability for redirecting low-value directions or deepening promising ones during execution. Existing interactive approaches improve process visibility and open intervention points, but they remain largely designed for discrete, turn-by-turn exchanges rather than the parallel branches and evolving decision structures of long-running agentic analysis. We study this need as interactive oversight in long-running agentic data analysis and present AdaLens, an interactive system for monitoring and steering ongoing runs. AdaLens combines a storyline-based representation that unifies analytical plans, execution progress, intermediate findings, and data-column involvement with steering interactions grounded in these analytical elements for directional guidance and execution control. We evaluate AdaLens through two case studies and a user study, examining how it supports analysts in monitoring and steering long-running agentic data analysis.
@article{liu2026adalens,title={AdaLens: Interactive Storyline for Monitoring and Steering Long-Running Agentic Data Analysis},author={Liu, Yangtian and Miao, Yan and Liu, Shuhan and Zhou, Yunfan and Kim, Dae Hyun and Weng, Di and Wu, Yingcai},journal={arXiv preprint arXiv:2608.17834},year={2026},month=aug,}
UIST
ChronoMantic: A Natural Language Interface for Interactive Time Series Pattern Query
Yangtian Liu, Shuhan Liu, Guobin Tu, Yunfan Zhou, Xiwen Cai, Di Weng*, and Yingcai Wu
In Proceedings of the 39th Annual ACM Symposium on User Interface Software and Technology (UIST), 2026
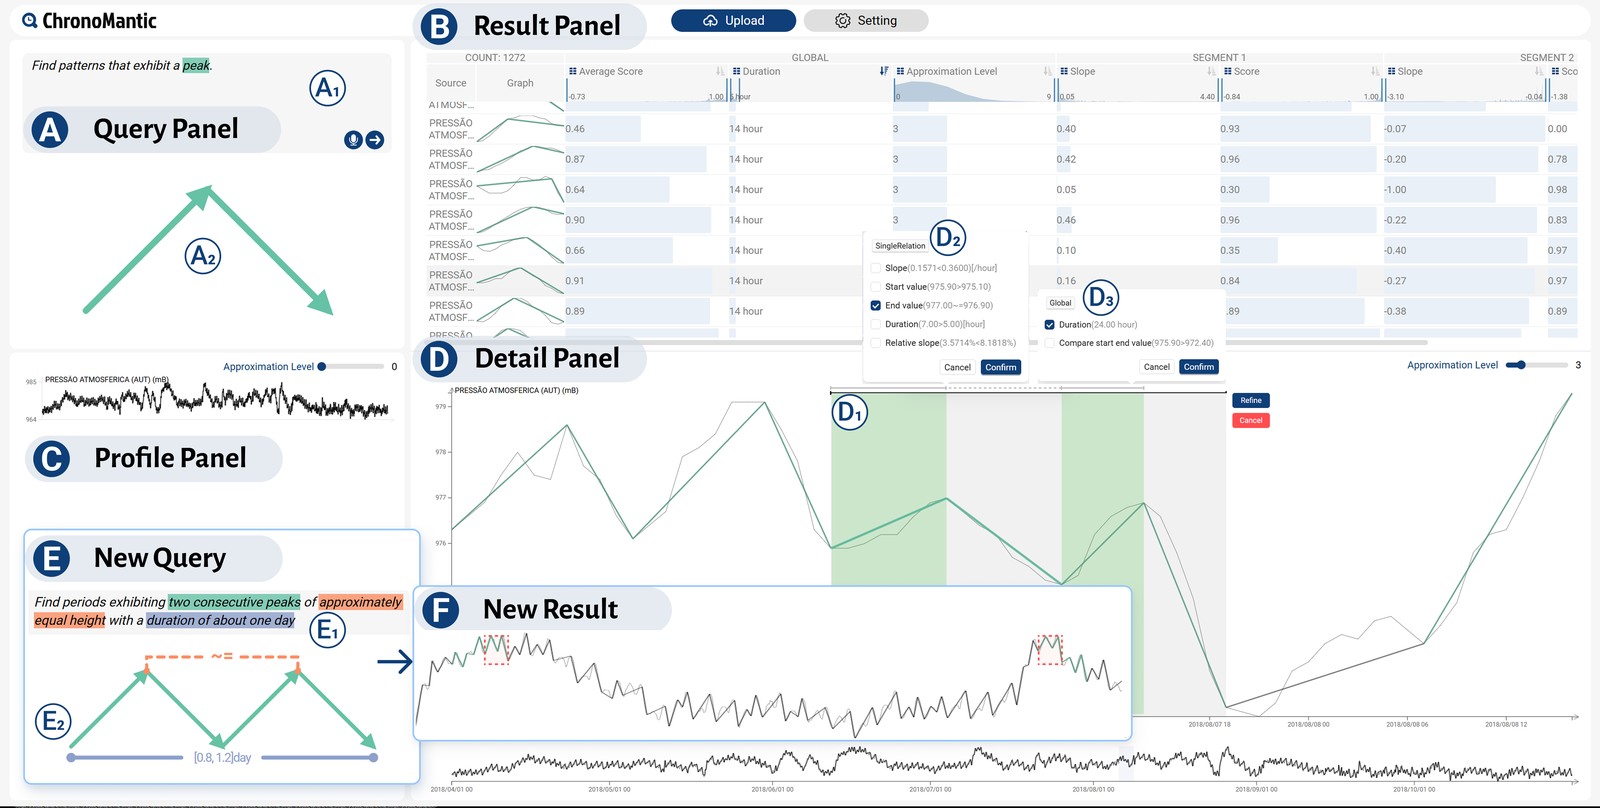
Finding time series patterns is an important problem in finance, healthcare, climatology, and manufacturing, where temporal data analysis informs critical decision-making processes. Existing approaches use examples, sketches, and natural language (NL) for time series pattern querying, but precisely formulating complex queries, inspecting query interpretations, and refining queries iteratively remain challenging. Nevertheless, NL is a promising modality for pattern specification, balancing expressiveness and preciseness while providing an intuitive means of articulating query intent. This paper introduces ChronoMantic, an NL-driven interactive interface for time series pattern querying. The tool provides glyph-based feedback on query interpretation and supports iterative querying through by-example refinement. We illustrate ChronoMantic’s workflow through two usage scenarios, assess its retrieval performance on a manually annotated benchmark, and evaluate its query effectiveness and usability via a two-stage user study.
@inproceedings{liu2026chronomantic,title={ChronoMantic: A Natural Language Interface for Interactive Time Series Pattern Query},author={Liu, Yangtian and Liu, Shuhan and Tu, Guobin and Zhou, Yunfan and Cai, Xiwen and Weng, Di and Wu, Yingcai},booktitle={Proceedings of the 39th Annual ACM Symposium on User Interface Software and Technology (UIST)},year={2026},doi={10.1145/3830398.3830491},}
CHI
RidgeBuilder: Interactive Authoring of Expressive Ridgeline Plots
Shuhan Liu, Yangtian Liu, Junxin Li, Yanwei Huang, Yue Shangguan, Zikun Deng, Di Weng*, and Yingcai Wu
In Proceedings of the ACM Conference on Human Factors in Computing Systems (CHI), 2025
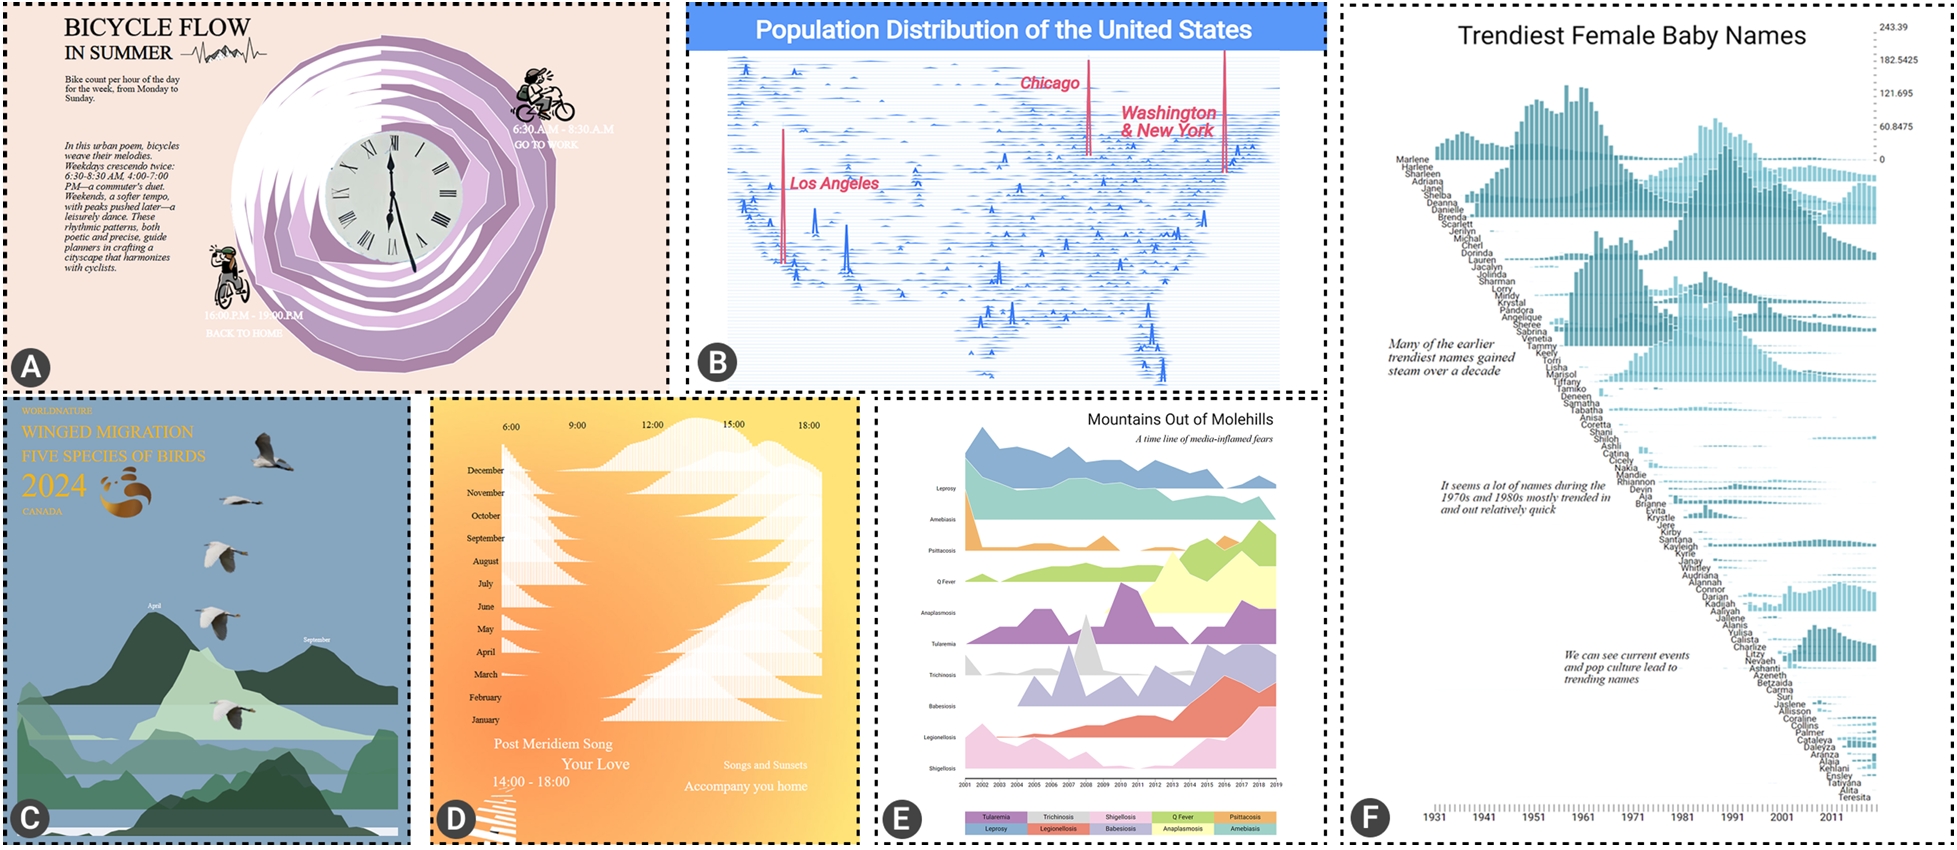
Ridgeline plots are frequently used to visualize the evolution or distributions of multiple series using a pile of overlapping line, area, or bar charts, highlighting the peak patterns among these series. While the existing studies have mainly seen ridgeline plots as a type of small multiple visualization, the signature ridge-like patterns in these plots have increasingly attracted graphic designers to create appealing data visualizations based on customized ridgeline plots. However, many authoring tools only support creating basic ridgeline plots and overlook the diverse layouts and styles of these plots. In this paper, we present a comprehensive design space of ridgeline plots by surveying the usages of such plots, specifically focusing on delineating their diverse layouts and expressive styles. Based on this design space, we introduce RidgeBuilder, an intuitive tool that facilitates the fast authoring of expressive ridgeline plots with intuitive interactions and user-friendly recommendations. In particular, we summarize three goals for refining the layout of ridgeline plots and propose an optimization method that automatically generates an optimal order of the series in the plots. The effectiveness of RidgeBuilder is evaluated with a replication study where the participants were asked to recreate the existing complex ridgeline plots, and both qualitative and quantitative results indicate good usability and usefulness. We also evaluate the efficiency and effectiveness of the proposed layout optimization algorithm with anonymized questionnaires. Furthermore, the expressiveness of RidgeBuilder are demonstrated with a gallery of ridgeline plots created by our tool.
@inproceedings{liu2025ridgebuilder,title={RidgeBuilder: Interactive Authoring of Expressive Ridgeline Plots},author={Liu, Shuhan and Liu, Yangtian and Li, Junxin and Huang, Yanwei and Shangguan, Yue and Deng, Zikun and Weng, Di and Wu, Yingcai},booktitle={Proceedings of the ACM Conference on Human Factors in Computing Systems (CHI)},year={2025},doi={10.1145/3706598.3714209},}